Berikut merupakan kutipan ilmiah klimatologi dan geofisika yang bermanfaat yang disusun dan digunakan sebagai referensi pribadi.
No frequent flyer is a stranger to turbulence. But what causes it, and how dangerous is it?
No frequent flyer is a stranger to turbulence. But what causes it, and how dangerous is it?
Turbulence is the random, chaotic motion of air, caused by changes in air currents. From inside an airplane, it can range from minor bumpiness that can jostle the cranberry juice on your tray to powerful jolts that can structurally damage the plane and injure its passengers. Each year, pilots report about 65,000 accounts of moderate or greater turbulence and 5,500 accounts of severe turbulence. Turbulence is responsible for roughly 75 percent of all weather-related accidents and incidents, according to the National Transportation Safety Board.
But modern planes are hardy, and built to withstand even severe turbulence. Turbulence extreme enough to damage a commercial airplane is extremely rare, and pilots have ways of both handling and avoiding it.
“Aircraft reaction to turbulence varies with the difference in windspeed in adjacent currents, size of aircraft, wing loading, airspeed, and aircraft altitude, according to a text on aviation weather, published by the FAA. “When an aircraft travels rapidly from one current to another, it undergoes abrupt changes in acceleration.”
Most turbulence is weather related, said Alan Yurman, a retired air safety investigator with the National Transportation Safety Board and an aviation consultant. Yurman said you can understand turbulence by visualizing a boat. As the boat goes through water, it causes ripples, waves and eddies. Air is the same way. Air currents, weather patterns and even other planes can make the air rough and bumpy.
Pilots are taught to slow down when they encounter turbulence. “What you don’t want to do is fight the turbulence,” Yurman said. “If turbulence is causing you to go up, you don’t want to push down hard on the controls, you want to try to slow down and ride it out to the other side. You don’t make any sudden control moves, because that could cause you to overstress the airplane.”
Here are some of the different kinds of turbulence that planes encounter:
Clear-air Turbulence
Clear-air turbulence, known in the industry as CAT, is common at high altitudes but hard to predict since it’s invisible to weather radar, which can only see inside of clouds. It’s usually caused by shifting jet streams.
Jet streams are fast rivers of air. Below and above these rivers are wind shears, or rapid changes in wind speed. Where there’s a jet stream, there’s shear, and where there’s shear there’s turbulence, said Bob Sharman, a project scientist at the National Center for Atmospheric Research. “The worst turbulence isn’t right at the heart of the jet stream, it’s at the sides of the jet stream. That’s where the shear is largest, and the shear kind of rips apart the air and causes turbulence.”
USA Today’s John Cox, a retired airline captain with U.S. Airways and a consultant, talks about it here. Today’s modern planes are very capable of handling this kind of turbulence, he says.
Wind Shear
While wind shears in the upper atmosphere are usually vertical, they tend to be horizontal closer to the runway. Horizontal wind shears can create eddies or swirls, of air that cause turbulence. A microburst is a type of wind shear associated with a thunderstorm and caused by a current of sinking air. The problem with microbursts is that they often occur as an airplane is departing or landing, creating little room for error, said Corey Ferguson, a Boeing 777 captain and a consultant for Aviation Experts.
“At altitude, if you were to lose 1,000 feet, no problem,” Ferguson said. “There are no mountains up there. But if at 500 feet, you lose 1,000 feet of altitude, you’d be 500 feet underground. The bottom line is you don’t have the potential energy or safety of additional room above the ground. There’s less room for error and recovery from a wind shear encounter.”
For this reason, a warning about a wind shear during descent could prompt a pilot to climb away from the airport rather than land. “Go arounds” such as this occur about once every 300 to 500 landings, Ferguson added.
Mountain Wave
Wind blowing across a mountain pass can take on the form of a wave as it comes in contact with the mountain, forcing air over it and setting it in oscillation. These atmospheric waves may become turbulent, like a breaking ocean wave. The waves can extend 100 miles or more downwind from the mountain and well above even the highest peaks, sometimes into the lower stratosphere. Turbulence in a mountain wave can range from very mild to violent enough to damage an airplane.
It’s common to encounter this kind of turbulence while flying over the Rocky Mountains, the Sierra Nevada or Wasatch mountain range. Mountain wave turbulence is also common over Greenland, often encountered en route from Europe to the United States.
“Some of the worst turbulence we see is associated with breaking mountain waves,” Sharman said. “Even if the wave is not breaking, it can cause an airplane to go up and down more than a pilot would like, and that can be dangerous.” Planes can rise or plummet as far as 1,000 feet, he said, which could land them at the flight level of another aircraft.
Like clear-air turbulence, this kind often has no visual indicator, and it’s highly transient as it moves around, making reports by other pilots unreliable.
In 1992, a package carrier struck a mountain wave while flying over Evergreen, Colo. The wave was so violent, it ripped off part of the plane’s wing and outboard engine. Still, the pilot managed to land safely in Denver.
But that was very unusual. Aviation experts said that only in extremely rare events have mountain waves caused crashes. “I don’t know of any commercial airliner that’s gone down because of one,” Sharman said.
Wake Turbulence
Planes themselves can also cause turbulence. Just like a ski boat creates eddies and waves in the water, rapidly spinning air currents can develop off the wing tips of an aircraft. These vortices can cause a following plane to roll. Such air currents decay fairly rapidly, so if planes are far enough apart, it’s not a problem.
“It’s encountered normally when on approach to an airport with closely-spaced runways, Ferguson said.
Thermal-induced Turbulence
Convective currents, most active on warm summer afternoons, are a common cause of turbulence at low altitudes and can impact planes during take-off or landing. Air that is heated near the ground rises, but since different surfaces have a hotter surface area than others — think sandy wasteland or plowed fields versus cooler forest or water — the air heats unevenly, causing different hot spots and abrupt changes in airspeed that can be dangerous at low altitudes.
This can be a problem in a place like Phoenix that has a lot of surface area heating during the day.
Thunderstorms
Thunderstorms can also create severe turbulence that pilots are taught to avoid. “It can be very violent, going up and down,” Yurman said. “You can have currents going up in some places and coming down suddenly — vertical, shearing-type currents. These are really dangerous. They’ve torn planes apart.”
While turbulence can occur inside thunderstorms, it can also occur in the clear air around the storm. This is called convectively-induced turbulence.
Fortunately, there are many warning systems for pilots. Ground radar, airplane radar and pilot reports will all alert a pilot to thunderstorms.
Here’s USA Today’s Cox on thunderstorms:
Thunderstorms create turbulence by pulling large amounts of air in and sending it upwards very rapidly. Once this air cools, it has to come down, as it is heavier than the surrounding air. When it does, it can create microburst and very turbulent conditions. Pilots avoid thunderstorms by using weather radar which shows the precipitation within the storm. Newer generation radar can also show areas of turbulence. Each airline has specific guidance to pilots on minimum distances from storms.
Turbulence is disturbing because you can’t control it, you can only maneuver around it, Ferguson said, but stresses that damage to a plane from turbulence is extremely rare.
“Sometimes, from point A to point B, turbulence is everywhere,” he said. “We know we’re going to get through it, and it’s not going to be a fun ride today. But at altitude we’ve had a very very small number of problems as a result of turbulence.”
More often, airplane injuries are a result of people getting banged around the cabin, a problem with a simple solution, Sharman said: “If people can just keep their seatbelts fastened all the time, it would cut down on the number of incidents.”
A microburst is a small-scale downburst, thus a very localized column of sinking air caused by a small and intensedowndraft (the air does not spin like it does in the case of a cyclone or tornado)[1] within a thunderstorm. There are two types of microbursts: wet microbursts and dry microbursts. They go through three stages in their life cycle: the downburst, outburst, and cushion stages. The scale and suddenness of a microburst makes it a great danger to aircraft due to the low-level wind shear caused by its gust front, with several fatal crashes having been attributed to the phenomenon over the past several decades.
A microburst often has high winds that can knock over fully grown trees. They usually last for a duration of a couple of seconds to several minutes.
The term was defined by mesoscale meteorology expert Ted Fujita as affecting an area 4 km (2.5 mi) in diameter or less, distinguishing them as a type of downburst and apart from common wind shear which can encompass greater areas.[2] Fujita also coined the termmacroburst for downbursts larger than 4 km (2.5 mi).[3]
A distinction can be made between a wet microburst which consists of precipitation and a dry microburst which typically consists of virga.[4] They generally are formed by precipitation-cooled air rushing to the surface, but they perhaps also could be powered from the high speed winds of the jet stream deflected toward the surface by a thunderstorm or by dynamical processes (see rear flank downdraft).
Microbursts are recognized as capable of generating wind speeds higher than 75 m/s (170 mph; 270 km/h).
When rain falls below cloud base or is mixed with dry air, it begins to evaporate and this evaporation process cools the air. The cool air descends and accelerates as it approaches the ground. When the cool air approaches the ground, it spreads out in all directions and this divergence of the wind is the signature of the microburst. High winds spread out in this type of pattern showing little or no curvature are known as straight-line winds.[5]
Dry microbursts, produced by high based thunderstorms that generate little to no surface rainfall, occur in environments characterized by a thermodynamic profile exhibiting an inverted-V at thermal and moisture profile, as viewed on a Skew-T log-P thermodynamic diagram. Wakimoto (1985) developed a conceptual model (over the High Plains of the United States) of a dry microburst environment that comprised three important variables: mid-level moisture, a deep and dry adiabatic lapse rate in the sub-cloud layer, and low surface relative humidity.
Wet microbursts are downbursts accompanied by significant precipitation at the surface which are warmer than their environment (Wakimoto, 1998).[6] These downbursts rely more on the drag of precipitation for downward acceleration ofparcels than negative buoyancy which tend to drive "dry" microbursts. As a result, higher mixing ratios are necessary for these downbursts to form (hence the name "wet" microbursts). Melting of ice, particularly hail, appears to play an important role in downburst formation (Wakimoto and Bringi, 1988), especially in the lowest 1 km (0.62 mi) above ground level (Proctor, 1989). These factors, among others, make forecasting wet microbursts a difficult task.
| Characteristic | Dry Microburst | Wet Microburst |
|---|---|---|
| Location of highest probability within the United States | Midwest / West | Southeast |
| Precipitation | Little or none | Moderate or heavy |
| Cloud bases | As high as 500 mb (hPa) | As high as 850 mb (hPa) |
| Features below cloud base | Virga | Shafts of strong precipitation reaching the ground |
| Primary catalyst | Evaporative cooling | Downward transport of higher momentum |
| Environment below cloud base | Deep dry layer/low relative humidity/dry adiabatic lapse rate | Shallow dry layer/high relative humidity/moist adiabatic lapse rate |
| Surface outflow pattern | Omni-directional | Gusts of the direction of the mid-level wind |
Development stages of microbursts[edit]
The evolution of downbursts is broken down into three stages: the contact stage, the outburst stage, and the cushion stage.


Physical processes of dry and wet microbursts[edit]
| This article needs attention from an expert in meteorology. (February 2009) |

Basic physical processes using simplified buoyancy equations[edit]
Start by using the vertical momentum equation
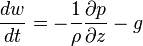
By decomposing the variables into a basic state and a perturbation, defining the basic states, and using the ideal gas law ( ), then the equation can be written in the form
), then the equation can be written in the form
where B is buoyancy. The virtual temperature correction usually is rather small and to a good approximation; it can be ignored when computing buoyancy. Finally, the effects of precipitation loading on the vertical motion are parametrized by including a term that decreases buoyancy as the liquid water mixing ratio ( ) increases, leading to the final form of the parcel's momentum equation:
) increases, leading to the final form of the parcel's momentum equation:
The first term is the effect of perturbation pressure gradients on vertical motion. In some storms this term has a large effect on updrafts (Rotunno and Klemp, 1982) but there is not much reason to believe it has much of an impact on downdrafts (at least to a first approximation) and therefore will be ignored.
The second term is the effect of buoyancy on vertical motion. Clearly, in the case of microbursts, one expects to find that B is negative meaning the parcel is cooler than its environment. This cooling typically takes place as a result of phase changes (evaporation, melting, and sublimation). Precipitation particles that are small, but are in great quantity, promote a maximum contribution to cooling and, hence, to creation of negative buoyancy. The major contribution to this process is from evaporation.
The last term is the effect of water loading. Whereas evaporation is promoted by large numbers of small droplets, it only requires a few large drops to contribute substantially to the downward acceleration of air parcels. This term is associated with storms having high precipitation rates. Comparing the effects of water loading to those associated with buoyancy, if a parcel has a liquid water mixing ration of 1.0 g kg−1, this is roughly equivalent to about 0.3 K of negative buoyancy; the latter is a large (but not extreme) value. Therefore, in general terms, negative buoyancy is typically the major contributor to downdrafts.[8]
Negative vertical motion associated only with buoyancy[edit]
Using pure "parcel theory" results in a prediction of the maximum downdraft of

where NAPE is the negative available potential energy,
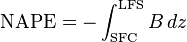
and where LFS denotes the level of free sink for a descending parcel and SFC denotes the surface. This means that the maximum downward motion is associated with the integrated negative buoyancy. Even a relatively modest negative buoyancy can result in a substantial downdraft if it is maintained over a relatively large depth. A downward speed of 25 m/s (56 mph; 90 km/h) results from the relatively modest NAPE value of 312.5 m2 s−2. To a first approximation, the maximum gust is roughly equal to the maximum downdraft speed.[8]
Danger to aircraft[edit]
Further information: Downburst and Wind shear

The scale and suddenness of a microburst makes it a notorious danger to aircraft, particularly those at low altitude which aretaking off or landing. The following are some fatal crashes and/or aircraft incidents that have been attributed to microbursts in the vicinity of airports:
- A BOAC Canadair C-4 (G-ALHE), Kano Airport - 24 June 1956.
- A Malév Ilyushin Il-18 (HA-MOC), Copenhagen Airport – 28 August 1971.
- Eastern Air Lines Flight 66 Boeing 727-225(N8845E), John F. Kennedy International Airport – 24 June 1975[9]
- Pan Am Flight 759 Boeing 727-235 (N4737), New Orleans International Airport – 9 July 1982[9]
- Delta Air Lines Flight 191 Lockheed L-1011 TriStar (N726DA), Dallas/Fort Worth International Airport – 2 August 1985[9]
- Martinair Flight 495 McDonnell Douglas DC-10 (PH-MBN), Faro Airport – 21 December 1992[10]
- USAir Flight 1016 Douglas DC-9 (N954VJ), Charlotte/Douglas International Airport – 2 July 1994
- Goodyear Blimp GZ-20A (N1A, "Stars and Stripes"), Coral Springs, Florida – 16 June 2005
- Bhoja Air Flight 213 Boeing 737-200 (AP-BKC), Islamabad International Airport, Islamabad, Pakistan- April 20, 2012
A microburst often causes aircraft to crash when they are attempting to land (the above-mentioned BOAC and Pan Am flights are notable exceptions). The microburst is an extremely powerful gust of air that, once hitting the ground, spreads in all directions. As the aircraft is coming in to land, the pilots try to slow the plane to an appropriate speed. When the microburst hits, the pilots will see a large spike in their airspeed, caused by the force of the headwind created by the microburst. A pilot inexperienced with microbursts would try to decrease the speed. The plane would then travel through the microburst, and fly into the tailwind, causing a sudden decrease in the amount of air flowing across the wings. The decrease in airflow over the wings of the aircraft causes a drop in the amount of lift produced. This decrease in lift combined with a strong downward flow of air can cause the thrust required to remain at altitude to exceed what is available, thus causing the aircraft to stall.[9] If the plane is at a low altitude shortly after takeoff or during landing, it will not have sufficient altitude to recover.
While the danger from winter weather varies across the country, nearly all Americans, regardless of where they live, are likely to face some type of severe winter weather at some point in their lives. Winter storms can range from a moderate snow over a few hours to a blizzard with blinding, wind-driven snow that lasts for several days. Many winter storms are accompanied by dangerously low temperatures and sometimes by strong winds, icing, sleet and freezing rain.
One of the primary concerns is the winter weather's ability to knock out heat, power and communications services to your home or office, sometimes for days at a time. Heavy snowfall and extreme cold can immobilize an entire region.
The National Weather Service refers to winter storms as the “Deceptive Killers” because most deaths are indirectly related to the storm. Instead, people die in traffic accidents on icy roads and of hypothermia from prolonged exposure to cold. It is important to be prepared for winter weather before it strikes.
Tropical Cyclones (Hurricanes) Fall 2014
|
This document last updated on 19-Aug-2014
Before discussing the science of tropical cyclones (hurricanes as they are called when in the Atlantic or eastern Pacific oceans), we need to first understand something about atmospheric circulation in the lower part of the atmosphere (troposphere).
Atmospheric Circulation
The troposphere undergoes circulation because of convection. Convection is a mode of heat transfer wherin the heat moves with the material. Warm air, becuase it is less dense than cooler air, rises and cold air sinks back toward the surface. Convection in the atmosphere is mainly the result of the fact that more of the Sun's heat energy is received by parts of the Earth near the Equator than at the poles.
Thus air at the equator is heated reducing its the density. Lower density causes the air to rise. At the top of the troposphere this air spreads toward the poles.
|
 |
| If the Earth were not rotating, this would result in a convection cell, with warm moist air rising at the equator, spreading toward the poles along the top of the troposphere, cooling as it moves poleward, then descending at the poles, as shown in the diagram above. Once back at the surface of the Earth, the dry cold air would circulate back toward the equator to become warmed once again.Areas where warm air rises and cools are centers of low atmospheric pressure. In areas where cold air descends back to the surface, pressure is higher and these are centers of high atmospheric pressure. |
| The Coriolis Effect - Again, the diagram above would only apply to a non-rotating Earth. Since the Earth is in fact rotating, atmospheric circulation patterns are much more complex. The reason for this is the Coriolis Effect. The Coriolis Effect causes any body that moves on a rotating planet to turn to the right (clockwise) in the northern hemisphere and to the left (counterclockwise) in the southern hemisphere. The effect is negligible at the equator and increases both north and south toward the poles. |  |
| The Coriolis Effect occurs because the Earth rotates out from under all moving bodies like water, air, and even airplanes. Note that the Coriolis effect depends on the initial direction of motion and not on the compass direction. If you look along the initial direction of motion the mass will be deflected toward the right in the northern hemisphere and toward the left in the southern hemisphere. | |
| Wind Systems | |
|  |
|  |
 |
|
|
|
 |
|
Water and Heat
Water has one of the highest heat capacities of all known substances. This means that it takes a lot of heat to raise the temperature of water by just one degree. Water thus absorbs a tremendous amount of heat from solar radiation, and furthermore, because solar radiation can penetrate water easily, large amounts of solar energy are stored in the world's oceans.
|
| Further energy is absorbed by water vapor as the latent heat of vaporization, which is the heat required to evaporate water or change it from a liquid to a vapor. This latent heat of vaporization is given up to the atmosphere when water condenses to form liquid water as rain. If the rain changes to a solid in the form of snow or ice, it also releases a quantity of heat known as the latent heat of fusion. Thus, both liquid water and water vapor are important in absorbing heat from solar radiation and transporting and redistributing this heat around the planet. |  |
| This heat provides the energy to drive the convection system in the atmosphere and thus drives the water cycle and is responsible for such hazards as floods, thunderstorms, tornadoes, and tropical cyclones. |
Air Masses
|
Due to general atmospheric circulation patterns, air masses containing differing amounts of heat and moisture move into and across North America. Polar air masses, containing little moisture and low temperatures move downward from the poles. Air masses that form over water are generally moist, and those that form over the tropical oceans are both moist and warm. Because of the Coriolis effect due to the Earth's rotation, air masses generally move across North America from west to east. But, because of the differences in moisture and heat, the collision of these air masses can cause instability in the atmosphere. |  |
Fronts and Mid-latitude Cyclones Different air masses with different temperatures and moisture content, in general, do not mix when they run into each other, but instead are separated from each other along boundaries called fronts. When cold air moving down from the poles encounters warm moist air moving up from the Gulf of Mexico, Pacific Ocean, or Atlantic Ocean, a cold front develops and the warm moist air rises above the cold front. |
| This rising moist air cools as it rises causing the condensation of water vapor to form rain or snow. Note that the cold air masses tend to circulate around a low pressure center in a counterclockwise fashion in the northern hemisphere. Such circulation around a low pressure center is called a mid-latitude cyclone. |  |
| When warm air moving northward meets the cooler air to the north, a warm front forms. As the warm air rises along a gently inclined warm front, clouds tend to form, and can also cause rain, but rain is less likely because the warm front is not as steep as a cold front. If the rapidly moving cold front overtakes the warm front, an occluded front forms, trapping warm air above a layer of cold and cool air. Mid-latitude cyclones and their associated fronts are responsible for such severe weather conditions as thunderstorms, snow storms and associated hail, lightening, and occasional tornadoes. |  |
Hurricanes (Tropical Cyclones)
Tropical Cyclones are massive tropical cyclonic storm systems with winds exceeding 119 km/hr (74 miles/hour). The same phenomena is given different names in different parts of the world. In the Atlantic Ocean and eastern Pacific ocean they are called hurricanes. In the western Pacific they are called typhoons, and in the southern hemisphere they are called cyclones. But, no matter where they occur they represent the same process. Tropical cyclones are dangerous because of their high winds, the storm surge produced as they approach a coast, and the severe thunderstorms associated with them. Although death due to hurricanes has decreased in recent years due to better methods of forecasting and establishment of early warning systems, the economic damage from hurricanes has increased as more and more development takes place along coastlines. It should be noted that coastal areas are not the only areas subject to hurricane damage. Although hurricanes loose strength as they move over land, they still carry vast amounts of moisture onto the land causing thunderstorms with associated flash floods and mass-wasting hazards.Origin of Hurricanes
|
 |
|
 |
|
|
| Hurricanes thus commonly develop in areas near, but not at the equator, as shown in the diagram below. As they move across the oceans their paths are steered by the presence of existing low and high pressure systems, as well as the Coriolis force. The latter force causes the storms to eventually start turning to the right in the northern hemisphere and to the left in the southern hemisphere. Note that about 12% of all tropical cyclones develop in the Atlantic Ocean. Those that begin to form near the coast of Africa are often referred to as "Cape Verde" hurricanes, because the area in which they develop is near the Cape Verde Islands. 15% of all tropical cyclones develop in the eastern Pacific Ocean, 30% develop in the western Pacific Ocean, 24% in the Indian Ocean both north and south of the equator, and 12% develop in the southern Pacific Ocean. It is notable that essentially no tropical cyclones develop south of the Equator in the Atlantic Ocean, although one occurred off the coast of Brazil in March of 2004.. |
 After Abbott (1996) |
| Tropical Cyclone Structure | |
| Because the converging winds spiral inward toward the central low pressure area, the winds rotate in a counterclockwise direction around the central low in the northern hemisphere (clockwise in the southern hemisphere). As these winds spiral inward they draw in the thunderclouds around the storm, creating the spiral rain bands that are clearly visible on satellite images of the storm (recall satellite images of hurricanes that are seen frequently on TV during hurricane season). |  |
| As the winds converge toward the central core, they spiral upwards, sending warm moist air upwards. As this air rises, it cools and releases its latent heat into the atmosphere to add further energy to the storm. The winds spiraling around this central core create the eye of the tropical cyclone and eventually spread out at high altitudes. Eventually, cool air above the eye begins to sink into the central core. This dry descending air within the eye gives the core a clear, cloud free sky, with little to no wind. Since the main source of energy for the storm is the heat contained in the warm tropical and subtropical oceans, if the storm moves over the land, it is cut off from its source of heat and will rapidly dissipate. |
 | Winds spiraling counterclockwise (in the northern hemisphere) into the eye of the hurricane achieve high velocities as they approach the low pressure of the eye. The velocity of these winds is called the hurricane-wind velocity. The central low pressure center of the eye also moves across the surface of the Earth as it is pushed by regional winds. The velocity at which the eye moves across the surface is called the storm center velocity. Thus, when we consider the velocity of winds around the hurricane we must take into account both the wind velocity and the storm center velocity. Depending on the side of the hurricane, these velocities can either add or subtract. In the example at the left, the hurricane is traveling north with a storm center velocity of 30 km/hr, and a hurricane-wind velocity of 150 km/hr. On the right hand side of the storm both velocities are to the north so the total wind velocity is 180 km/hr (30 + 150). On the left hand side of the storm, however, the wind is blowing to the south. |
| Thus, since the storm is moving in the opposite direction to the winds, the velocities subtract and the total wind velocity is 120 km/hr (150 - 30). This is an important point. Winds are always stronger on the right side of a moving hurricane in the northern hemisphere. (The opposite is true in the southern hemisphere, since winds circulate in a clockwise direction, the winds are stronger on the left-hand side of the storm in the southern hemisphere). |
Tropical Cyclone Size Since winds spiral inward toward the central low pressure area in the eye of a hurricane, hurricane-wind velocity increases toward the eye. The distance outward from the eye to which hurricane strength winds occur determines the size of the hurricane. Winds in the eye wall itself have the highest velocity and this zone can extend outward from the center to distances of 16 to 40 km. Hurricane force winds (winds with velocities greater than 119 km/hr) can extend out to 120 km from the center of the storm. The largest tropical cyclone recorded, Typhoon Tip, had gale force winds (54 km/hr) which extended out for 1100 km in radius in the Northwest Pacific in 1979. Hurricane Katrina, in 2005, was a large hurricane with tropical storm force winds extending outward from the eye about 320 km. The smallest, Cyclone Tracy, had gale force winds that only extended 50 km in radius when it struck Darwin, Australia, in 1974. There is very little association between hurricane intensity (either measured by maximum sustained winds or by central pressure) and size. Hurricane Andrew is a good example of a very intense tropical cyclone of small size. It had 922 mb central pressure and 230 km/hr sustained winds at landfall in Florida, but had gale force winds extending out to only about 150 km from the center. |
| Hurricane Intensity and FrequencyOnce a hurricane develops, the Saffir-Simpson Scale is used to classify a hurricane's intensity and damage potential. There are five possible categories. Category 1 storms are more common than category 5 storms. In a typical year, there may be many category 1 storms, but category 5 storms occur very infrequently. |
Saffir-Simpson Hurricane Damage-Potential Scale
| ||||
Scale Number
Category |
Central Pressure
mb (inches of mercury) |
Wind Speeds
mi/hr (km/hr) |
Storm Surge*
feet (meters) |
Observed
Damage |
| 1 | >980 (>28.94) | 74-95 (119-153) | 4-5 (1.2-1.5) | some damage to trees, shrubbery, and unanchored mobile homes |
|---|---|---|---|---|
| 2 | 965-979 (28.50-28.91) | 96-110 (154-177) | 6-8 (1.8-2.4) | major damage to mobile homes; damage buildings' roofs, and blow trees down |
| 3 | 945-964 (27.91-28.47) | 111-130 (178-209) | 9-12 (2.5-3.6) | destroy mobile homes; blow down large trees; damage small buildings |
| 4 | 920-944 (27.17-27.88) | 131-155 (210-249) | 13-18 (3.9-5.5) | completely destroy mobile homes; lower floors of structures near shore are susceptible to flooding |
| 5 | <920 (<27.17) | >155 (>250) | >18 (>5.5) | extensive damage to homes and industrial buildings; blow away small buildings; lower floors of structures within 500 meters of shore and less than 4.5 m (15 ft) above sea level are damaged |
| *Note that surge level is highly dependent on such factors as the recent history of the storm, the shape of the coastline, and the bathymetry of the sea floor along the coast. The numbers in this column should be used with caution in predicting storm surge levels.Note that beginning in 2010, the National Hurricane Center no longer assoicates the storm category based on wind speed with the height of the storm surge because the relationship is not well established. | ||||
| Again, because a hurricane derives its energy from the warm ocean waters in the topics and subtropics, hurricanes are more frequent in the late summer months. Thus, as seen in the graph, hurricanes in the Atlantic ocean are more frequent in the months of August, September and October. The peak occurs on September 10. Very few have been recorded in January through April. Monitoring and Tracking Hurricanes In the United States, hurricanes and developing tropical disturbances are monitored very closely. Such monitoring has drastically reduced the number of deaths from hurricanes in the last 50 years. Monitoring is conducted using several methods: |  |
|
| Changes in Hurricane Tracks and IntensitiesBecause hurricanes are influenced by large-scale air masses, they sometimes move along rather erratic paths. Hurricanes are especially influenced by the strength and direction of upper level winds. As noted above, strong upper level winds create a vertical wind shear that cause the top of the hurricane to be sheared off and result in the loss of strength of the storm. The erratic nature of a hurricane's path often makes it difficult to predict where and when it will make landfall prior to several hours before it actually does make landfall. In the lower latitudes, near the equator, hurricanes generally are pushed by the easterly trade winds and have storm center velocities that are relatively low (8 to 32 km/hr). As they move northward, storm center velocities generally increase to greater than 50 km/hr. |
| This increase in storm center velocity usually results from the interaction of the storm with other air masses. Off the eastern coast of the United States there is an area of semi-permanent high pressure, known as the Bermuda High. Other high pressure centers are continually moving eastward off of North America. If the hurricane encounters a low pressure trough between two high pressure centers, it is steered into the trough and follows it along a northeastward trend, increasing its velocity as it does so. |  |
Interaction with the land and other air masses are most responsible for changes in hurricane tracks and intensities. Some examples are shown on the map below. Two of the most erratic hurricane paths recorded are shown by Hurricane Betsy, in 1965 and Hurricane Elena in 1985. | |
|  |
In Florida and Louisiana it caused about $10.8 billion (2004 dollars) in damage and killed 76 people along its track. | |
|
|
| Angle of Hurricane Approach to Coast The amount of damage that occurs when a hurricane approaches a coast depends on the angle of approach. Two extreme examples illustrate this point. | |
 |
|
| Hurricanes with a coast-parallel track have the additional danger that small shifts in course make landfall forecasts difficult. |
| Storm SurgeHeavy winds produced by hurricanes push the ocean in front of them. As this water gets pushed into the shallow zones along the coastline sea level rises. Since the storm surge is driven by the winds, the height of the rise in sea level is related to the velocity of the wind. For a moving storm the greater winds occur on the right side of the storm (in the northern hemisphere). Sea level also rises beneath the eye of the storm due to the low pressure in the eye. But, the surge generated by this low pressure is usually much less than the wind-driven surge. The height of the storm surge depends on wind speed, the shape of the coastline, and variations in the water depth along the coast line. | |
| Height also depends on tidal cycles. If a storm approaches the coast during high tide, the storm surge will be higher than if it approaches during low tide. |  |
| Category 5 tropical cyclones can produce storm surges in excess of 6m (20 feet). The highest storm surge measured, 12.8 m (42 feet) occurred in 1899 in Australia. | |
Hurricane Katrina, in 2005, produced a 8.5 m (28 ft) storm surge along the Mississippi Gulf coast even though it was a category 3 hurricane when it made landfall. This high storm surge was due to the fact that only 24 hours before landfall it had been a category 5 hurricane and the water pushed in front of it was trapped along the Louisiana coast to the west where it could not escape.Because the storm surge occurs ahead of the eye of the storm, the surge will reach coastal areas long before the hurricane makes landfall. This is an important point to remember because flooding caused by the surge can destroy roads and bridges making evacuation before the storm impossible. | |
| Since thunderstorms accompany hurricanes, and these storms can strike inland areas long before the hurricane arrives, water draining from the land in streams and estuaries may be impeded by the storm surge that has pushed water up the streams and estuaries. It is also important to remember that water that is pushed onto the land by the approaching storm (the flood surge) will have to drain off after the storm has passed. Furthermore after passage of the storm the winds typically change direction and push the water in the opposite direction. Damage can also be caused by the retreating surge, called the ebb surge. Along coastal areas with barrier islands offshore, the surge may first destroy any bridges leading to the islands, and then cause water to overflow the islands. Barrier islands are not very safe places to be during an approaching hurricane! |  |
| Hurricane DamageHurricanes cause damage as a result of the high winds, the storm surge, heavy rain, and tornadoes that are often generated from the thunderstorms as they cross land areas. Strong winds can cause damage to structures, vegetation, and crops, as described in the Saffir-Simpson scale discussed previously. The collapse of structures can cause death. The storm surge and associated flooding, however, is what is most responsible for casualties. Extreme cases of storm surge casualties have occurred as recently as 1970 and 1990 in Bangladesh and 2008 in Myanmar.. Bangladesh is an area with high population density and with over 30% of the land surface less than 6 m above sea level. In 1970 a cyclone struck Bangladesh during the highest high tides (full moon). The storm surge was 7 m (23 ft.) high and resulted in about 400,000 deaths. Another cyclone in 1990 created a storm surge 6 m high and resulted in 148,000 deaths. The May 2008 cyclone in Myanmar is estimated to have killed 138,000. The amount of damage caused by a tropical cyclone is directly related to the intensity of the storm, the duration of the storm (related to its storm-center velocity, as discussed above), the angle at which it approaches the land, and the population density along the coastline. The table below shows how damages are expected to increase with increasing tropical storm category. Like the Richter scale for earthquakes, damage does not increase linearly with increasing hurricane category. |
Category 1 1 $33 million 2 10 $336 million 3 50 $1.4 billion 4 250 $8.2 billion 5 500 $5.9 billion Source: National Hurricane Center - http://www.aoml.noaa.gov/hrd/tcfaq/D5.html
| Predicting Hurricane Frequency and IntensityAs discussed above, modern methods of weather forecasting involving satellites, radar, etc. allow accurate tracking of the development and paths of hurricanes. In addition, computer models have been developed by the National Weather Service that enable the prediction of storm surge levels along the U.S. coast, given data on wind velocity, wind distribution, and storm center velocity. These models were accurate to within about 1 foot for the levels of the storm surge that accompanied Hurricane Hugo along the South Carolina coast in 1989 and Hurricane Katrina in 2005. Computer models have also been developed to predict the paths the storms will take and have met with moderate success. Accurate forecasting of storm tracks is more problematical because of the numerous variables involved and the erratic paths hurricanes sometimes take. Still the National Hurricane Center's accuracy of hurricane tracks has improved steadily over the last 25 years. As of 2002, the average error on a 24 hour forecast is - 80 mi., on the 48 hour forecast - 110 mi., and on the 72 hour forecast - 230 mi.Prediction of hurricane intensity (wind speed) is more problematic as too many factors are involved. Hurricanes are continually changing their intensity as they evolve and move into different environments. Without the ability to know which environmental factors are going to change, it is very difficult to expect improvement on intensity forecasting. Hurricane Katrina was expected to loose intensity as moved out of the warmer waters of the Gulf of Mexico. But, it showed a more rapid drop in intensity just before landfall because a mass of cooler dry air was pulled in from the northwest. |
Some progress has been made in predicting the number and intensity of storms for the Atlantic Ocean by Dr. William Gray of Colorado State University. He has shown that there is a correlation between the frequency of intense Atlantic hurricanes with the amount of rainfall in western Africa in the preceding year. This correlation has allowed fairly accurate forecasts of the number of storms of a given intensity that will form each year. The 1997 predictions, however, did not take into account the effects of El Niño, which reduces the number of hurricanes. Nevertheless, Dr. Gray's predictions are closely watched, and have been otherwise fairly accurate.Reducing Hurricane DamageThere is plenty of historical data on hurricane damage in the United States so that it is not difficult to see ways that damage from hurricanes can be reduced. In terms of protection of human life, the best possible solution is to evacuate areas before a hurricane and its associated storm surge reaches coastal areas. Other measures can be undertaken to reduce hurricane damage as well.
AIRCRAFT WEATHER MITIGATION
FOR THE NEXT GENERATION AIR TRANSPORTATION SYSTEM
H. Paul Stough, III *
NASA Langley Research Center, Hampton, Virginia
1. INTRODUCTION
In December, 2004, an Integrated National
Plan for the Next Generation Air Transportation
System (NGATS) was submitted to the U.S.
Congress (Joint Planning and Development Office
2004). This system is envisioned to be more
flexible than that currently in place so as to
accommodate new air travel options and to handle
up to three times the current level of operations. A
Joint Planning and Development Office (JPDO)
has been created to develop and guide the
collaborative planning efforts of the Department of
Transportation, Department of Commerce,
Department of Homeland Security, the Federal
Aviation Administration, the National Aeronautics
and Space Administration, the White House Office
of Science and Technology Policy, and other
experts from the public and private sector to
achieve NGATS. The JPDO organization includes
eight interagency integrated product teams (IPT),
one of which, the Weather IPT, addresses the
impact of weather on the safety, efficiency, and
capacity of the air transportation system. This
paper describes the challenges for improving
aircraft weather mitigation to enable further
increases in the efficiency and capacity of the air
transportation system without compromising
safety.
2. AIRCRAFT WEATHER MITIGATION
Atmospheric effects on aviation are described
by Mahapatra (1999) as including (1) atmospheric
phenomena involving air motion – wind shear and
turbulence; (2) hydrometeorological phenomena –
rain, snow and hail; (3) aircraft icing; (4) low
visibility; and (5) atmospheric electrical
phenomena. Aircraft Weather Mitigation includes
aircraft systems (e.g. airframe, propulsion,
avionics, controls) that can be enacted (by a pilot,
automation or hybrid systems) to suppress and/or prepare for the effects of encountered or
unavoidable weather or to facilitate a crew
operational decision-making process relative to
weather. Aircraft weather mitigation can be
thought of as a continuum (Figure 1) with the need
to avoid all adverse weather at one extreme and
the ability to safely operate in all weather
conditions at the other extreme.
Realistic aircraft capabilities fall somewhere
between these two extremes. The capabilities of
small general aviation aircraft would be expected
to fall closer to the “Avoid All Adverse Weather”
point, and the capabilities of large commercial jet
transports would fall closer to the “Operate in All
Weather Conditions” point. The ability to safely
operate in adverse weather conditions is
dependent upon the pilot’s capabilities (training,
total experience and recent experience), the
airspace in which the operation is taking place
(terrain, navigational aids, traffic separation), the
capabilities of the airport (approach guidance,
runway and taxiway lighting, availability of air
traffic control), as well as the capabilities of the
airplane. The level of mitigation may vary
depending upon the type of adverse weather. For
example, a small general aviation airplane may be
equipped to operate “in the clouds” without outside
visual references, but not be equipped to prevent
airframe ice that could be accreted in those
clouds.
2.1 Weather Avoidance
Avoidance of hazardous weather is dependent
upon the availability and timeliness of
observations, accuracy of forecasts, timely
dissemination and presentation of this information
to flight crews, and the integration of this weather
information into the flight management decision
process. Observations, forecasts, communication,
and information integration are key elements of
hazardous weather avoidance. The flight crew
utilizes information derived from onboard sensors
and off-airplane sources in conjunction with the
out-the-window view and motion cues to establish
their routing through or around adverse weather.
The availability of affordable, compact,
lightweight, high-performance, data processing
systems and high-capacity digital data links has
facilitated the development of cockpit weather
information systems to aid pilots in making
weather-related decisions. A cockpit weather
information system (Figure 2) consists of weather
products, a means for transmitting the products,
and a means to present the information to the
pilot. However, pilots need more than just weather
information for in-flight decision making. They
need to consider aircraft capabilities, their own
piloting capabilities, and flight-path-relevant
terrain, obstacles, air space restrictions, and
traffic. Data links enable exchange of information
between airplanes and ground stations (Airline
Operations Centers, Flight Service Stations, and
Air Traffic Controllers). Aircraft-to-aircraft links
enable timely exchange of in situ weather reports.
Information from onboard sensors may be passed
to ground-based weather systems for
incorporation in updated forecasts and reports can
be subsequently transmitted to aircraft in flight.
Data-link weather information can be used to
augment onboard sensors such as weather radar
and lightning detectors. A prototype of such a
system, the Airborne Hazard Awareness System
(AHAS), has been developed and evaluated by a
NASA, Rockwell Collins, and Georgia Tech
Research Institute team (Stough et al 2005). Access to common information via data links and
collaboration among flight crews and ground traffic
managers should facilitate timely decision making
for the safe and efficient routing of aircraft.
2.2 Mitigation Examples
Over the past century, continual improvements
have increased the safety and operational
capabilities of aircraft, especially with respect to
weather. Some of these improvements include:
• Closed cabins with pressurization, heating
and cooling that enable flight at altitudes
above much of the adverse weather
• Lighting (airplane, airport and
obstructions) that enable flight at night and
in reduced visibility conditions
• Gyroscopic instruments for flight in
reduced visibility conditions
• Pneumatic boots, heated leading edges,
and de-icing fluid dispensers to remove or
prevent ice accumulation on wings, tails,
propellers, engine inlets, and other critical
surfaces
• Electrical “hardening” to prevent lightning
strikes from damaging critical components
• Onboard weather radar to detect and
visualize precipitation intensity a hundred
miles or more ahead of the airplane
• Anti-lock braking systems to prevent
skidding on slick runways
• Thrust reversers to assist braking on slick
runways
• De-icing fluids to clear airframes of ice
accumulations prior to takeoff
• Grooved runways to improve traction on
wet runways
• Autopilots and auto-throttles to precisely
maintain an established flight path
• Airport lighting, signage, and surface
markings to improve surface navigation at
night and in reduced visibility conditions
• Instrument Landing Systems to provide
precision approach guidance for landing in
reduced visibility conditions
Figure 2. Block diagram of a cockpit weather
information system • Crosswind landing gear to increase the
airplane’s safe crosswind landing limits
• Lightning detection systems to indicate
location of lightning discharges
• Gust alleviation systems to reduce
airplane motions and structural loads
caused by turbulence
• Flight Management Systems to generate
precise steering commands for piloted or
autopilot-assisted flight
• Auto-land systems to provide “hands-off”
approach and landing in low-visibility
conditions
• Wind shear detection and advisory
systems to provide guidance for safely
escaping wind shear encounters
• Enhanced and synthetic vision systems to
increase situational awareness during
landings in reduced visibility conditions
• Enhanced turbulence mode radar to
identify convectively-induced turbulence
twenty-five miles ahead of an airplane
As aircraft performance and ability to safely
operate in adverse weather have improved, the
desire has grown for aircraft to operate in more
demanding environments and even worse weather
conditions so as to enable further increases in the
efficiency and capacity of the air transportation
system.
3. NGATS and the JPDO
The Next Generation Air Transportation
System Integrated Plan (Joint Planning and
Development Office 2004) presents system goals
and performance characteristics in six areas to be
achieved by 2025: “(1) retain U.S. leadership in
global aviation; (2) expand capacity; (3) ensure
safety; (4) protect the environment; (5) ensure our
national defense; and (6) secure the nation.” The
significance of weather is clearly identified in the
objectives for expanding capacity: “satisfy future
growth in demand (up to 3 times current levels)
and operational diversity, reduce transit time and
increase predictability (domestic curb-to-curb
transit time cut by 30 %), and minimize the impact
of weather and other disruptions (95% on time).”
This expansion of capacity must include, and
consider the needs of, a wide range of customers,
including private, commercial, civil and military
aviation. Older, less-sophisticated, and lowerperformance
aircraft must be accommodated while
taking advantage of the capabilities of newer
more-sophisticated and higher-performance
aircraft. New vehicle classes, such as microjets
and unmanned aerial vehicles, are seen as being
a significant portion of NGATS operations by
2025.
The Integrated Plan includes eight major
strategies to address NGATS goals and
objectives: “(1) develop airport infrastructure to
meet future demand; (2) establish an effective
security system without limiting mobility or civil
liberties; (3) establish an agile air traffic system;
(4) establish user-specific situational awareness;
(5) establish a comprehensive proactive safety
management approach; (6) develop environmental
protection that allows sustained aviation growth;
(7) develop a system-wide capability to reduce
weather impacts; and (8) harmonize equipage and
operations globally.” The multi-agency Joint
Planning and Development Office (JPDO) has
created Integrated Product Teams (IPTs) to
identify what research and development is needed
and the entities that need to be involved in
executing these strategies. The eight IPTs are (1)
Airport Infrastructure, (2) Aviation Security, (3)
Agile Air Traffic Management System, (4) Shared
Situational Awareness, (5) Safety Management,
(6) Environmental Protection, (7) Weather, and (8)
Global Harmonization. Within the Weather IPT,
there are Sub-Teams to address Observations,
Forecasts, Dissemination, Integration, Mitigation,
Training and Policy. Systems Engineering
oversight is provided at the IPT level.
Communities outside the JPDO federal agencies
are engaged via the NGATS Institute and
participate as members of the IPT and SubTeams.
4. CONCEPT OF OPERATIONS
The Weather IPT has generated a NGATS
Weather Concept of Operations (Weather
Integrated Product Team 2006). This document is
subordinate to the JPDO NGATS Concept of
Operations (Joint Planning and Development
Office 2006) that is currently in draft form. In the
Weather Concept of Operations, aircraft systems
(e.g. airframe, propulsion, and avionics) are seen
as mitigating the effects of weather such as icing,
turbulence, and restrictions to visibility. These
aircraft systems significantly increase operational
capabilities of the aircraft and reduce the
associated airspace restrictions that can decrease
airspace system capacity.
For weather-related decisions, observations,
forecasts, and the level of mitigation that can be provided by on-board systems will be used to
determine the optimal path for avoiding the hazard
or for flying through the hazard region within the
capabilities of the mitigation systems. To illustrate
this concept, picture an airplane flying from point
“A” to point “B” as depicted in Figure 3. Adverse
weather exists between the two points during the
time of intended transit. Through observations
and forecasts, the region of adverse weather has
been delineated into levels of intensity ranging
from zero (no hazard) to ten (extreme hazard). If
the airplane is unable to fly through conditions
above level five, then it must be rerouted around
much of the weather. If the airplane has the ability
to fly through anything up to level seven intensity,
then it’s routing is unaffected. Enhanced weather
mitigation capability effectively increases the
usable airspace for such airplanes. Because this
airplane is not constrained to the lower level of
weather hazard, it has the indirect benefit of
reducing the traffic congestion in the regions of
lower hazard intensity.
A similar concept was embodied in a route
optimization decision aid developed by NASA and
Honeywell for avoiding aviation weather hazards
(Dorneich et al 2003). This aviation weather
information flight planning tool had six “sliders”
that could be adjusted to set acceptable hazard
thresholds, ranging from not desiring to encounter
any level of the hazard to willing to encounter the
most severe level of the hazard. The hazards
addressed by the prototype system included
convection (three levels of hazard), ice (three
levels of hazard), ozone (three levels of hazard),
turbulence (four levels of hazard), volcanic ash
(one level of hazard), and a “customer-defined
hazard”. Both vertical and lateral extent of the
hazards were considered by the route planning
tool. A shortcoming of this system was the need
for a meteorologist to generate the polygons that
described the boundaries of the different hazards
and associated intensities. In an NGATS
implementation, such a decision aid could derive
the boundaries automatically from digital position,
time, and probability data resident in the
envisioned single authoritative source for weather
information. Although the route optimization tool
was evaluated as a dispatcher’s decision aid, it
could be incorporated into an airplane’s onboard
flight management systems.
5. RESEARCH AND DEVELOPMENT
The research and development that needs to
be performed is being identified through the
definition of Operational Improvements (OIs) that
are needed to achieve the 2025 NGATS vision.
The Weather IPT has defined OIs in five major
areas – observation, forecast, dissemination,
integration and mitigation. For mitigation, the OI
describes aircraft weather mitigation
improvements in six areas:
(1) Turbulence
More effective turbulence-sensing and control
systems on new-design passenger and cargo
transport airplanes could alleviate aircraft
response to turbulence for both structural and
ride-comfort purposes.
(2) Icing
Enhancements to sensors and de-ice/anti-ice
systems for transport airplanes and near-allweather
GA airplanes could alleviate the
effects of icing for the purpose of maintaining
adequate aerodynamic, propulsion, and
control capabilities.
(3) Obstructions to Visibility
Broader application of systems such as
enhanced and synthetic vision could reduce
the impact of obstructions to visibility for
terminal area and ground operations.
Enhanced vision systems are being used by
some business and commercial operators
today. Synthetic vision systems are being
adopted by general and corporate aviation
(Adams 2006). Potential benefits include
runway identification on approach and taxiway
identification during ground operations. One
hurdle to improving the utility of synthetic
vision is real-time verification of the integrity of
the data used to generate the images. (4) Wake Vortices
Advanced configurations and flight control
systems for new-design passenger and cargo
transport airplanes may reduce the adverse
impacts of wake turbulence and enable closer
spacing on approach and departure, and safe
recovery from inadvertent wake encounters.
(5) Space Weather
Mitigation of the adverse effects of
electromagnetic radiation and charged
particles (space weather) on transport aircraft
systems (especially navigation systems) and
occupants could expand use of high altitudes
and polar routes.
(6) Atmospheric Particulates
Passenger and cargo transport airplanes
could benefit from systems to alleviate the
effects of heavy rain, frozen precipitation,
sand, dust, and volcanic ash on engine
performance, operability and serviceability.
Information on location and severity of these
hazards from observation and forecast systems
could be disseminated to the airplane in flight,
integrated with on-board sensor information
(including terrain, obstacles, air space and traffic),
and presented to the crew and automation
systems as regions of airspace that can be
navigated within acceptable encounter limits
based on phase of flight, aircraft configuration and
loading, and efficacy of the mitigation system.
Concepts for mitigation of weather-related
hazards must be assessed for feasibility. The cost
of development, implementation, and operation
must be weighed against the potential benefits
when utilized as part of an integrated weather
mitigation system that also considers costs and
operational benefits of enhancements to
observations, forecasts, dissemination, and
presentation of aviation weather information.
Absent a regulatory directive, operators will
determine whether such enhancements can “buy
their way onto the airplane” in an NGATS
environment.
6. SUMMARY
In the U.S., a Next Generation Air
Transportation System is envisioned that can
handle up to three times the current level of
operations. A key to achieving this level of
operations is minimizing the disruptions due to
adverse weather. In addition to improvements in
weather observing systems, forecasts,
communications, and information integration, there
is a desire for aircraft to operate in more
demanding environments and even worse weather
conditions than are currently possible, so as to
enable further increases in the efficiency and
capacity of the air transportation system. Needs
have been identified to improve aircraft and their
systems to counter the effects of turbulence, ice,
wake vortices, obstructions to visibility, space
weather, and atmospheric particulates. The
solution is seen as an integrated system of
observations, forecasts, information integration
and dissemination, and aircraft enhancements that
provide the greatest overall operational benefit for
the least cost.
7. REFERENCES
Adams, C., 2006: Avionics Magazine. Access
Intelligence, LLC, Rockville, MD. ISSN-1085-
9284, October 2006, Vol. 30, No. 10, pp8.
Dorneich, M. D., O. Olofinboba, S. Pratt, D.
Osborne, T. Feyereisen, and K. Latorella, 2003:
Evaluation of a Dispatcher’s Route Optimization
Decision Aid to Avoid Aviation Weather Hazards.
NASA/TM-2003-212172, 116pp.
Joint Planning and Development Office, 2004:
Next Generation Air Transportation System
Integrated Plan. Joint Planning and Development
Office, Washington, DC, 35pp.
Joint Planning and Development Office, 2006:
Concept of Operations for the Next Generation Air
Transportation System, Draft Version 0.2. Joint
Planning and Development Office, Washington,
DC, 105pp.
Mahapatra, P. R., R. J. Doviak, V. Mazur, and D.
Zrnic, 1999: Aviation Weather Surveillance
Systems. The American Institute of Aeronautics
and Astronautics and The Institution of Electrical
Engineers, Short Run Press Ltd, Exeter, England,
ISBN 1-56347-340-2, pp. 37-120.
Stough, H., J. Watson, T. Daniels, K. Martzaklis,
M. Jarrell, and R. Bogue, 2005: New Technologies
for Weather Accident Prevention. AIAA 5th Aviation
Technology, Integration, and Operations (ATIO)
Conference, Arlington, VA, AIAA-2005-7451,
25pp.
Weather Integrated Product Team, 2006: Next
Generation Air Transportation System Weather
Concept of Operations, version 1.0. Joint Planning
and Development Office, Washington, DC, 31pp. 8. AKNOWLEDGEMENTS
The author wishes to acknowledge the
members of the JPDO Weather IPT Aircraft
Weather Mitigation Sub-Team who contributed to
the concepts and material presented herein: Ron
Colantonio , Mary Wadel, and Jim Watson of the
National Aeronautics and Space Administration;
Larry Cornman of the National Center for
Atmospheric Research; Guy French of the U.S. Air
Force Research Lab; Gene Hill of the Federal
Aviation Administration; and John Polander of the
U.S. Air Force Weather Agency.
|
- Downburst
- List of microbursts
- Squall
- Vertical draft
- Low level windshear alert system (LLWAS)
- Planetary boundary layer (PBL)
- Convective storm detection
- Windthrow
Sumber : Internet
Tidak ada komentar:
Posting Komentar